





Do you know how to test your website speed? And why should you even care about it?
TL;DR: Numerous studies show that website speed has a huge impact on user experience and conversion rates, and Google demands it for SEO purposes, too.
What is Website Speed?

“Website speed” refers to the amount of time it takes for a browser to load a web page. Despite the name, it’s actually a page-by-page metric, though you can certainly evaluate the average page speed of a website as a whole. There are also several other metrics that, as a group, are called “Core Web Vitals.” For more on Core Web Vitals, check out this article.
Here are some interesting statistics about Core Web Vitals from recent studies:
- 51% of the 1,000 most popular mobile sites have good Core Web Vitals (CWV) 1
- Pages that meet all three CWV thresholds see users 24% less likely to abandon mid-load.”2
What Affects Website Speed?
Themes and Page Builders
The code present on the site, as a result of the use of WordPress themes and page builders, has an impact on speed as well. A poorly-coded theme or a page builder that generates bloated code can cause page load time issues.
From my personal experience, some of the worst offenders I’ve seen include WPBakery and Divi. We recommend that whenever possible, sites are built with speed-conscious themes and page builder providers. I used to recommend Elementor for that, but that one has come under some criticism lately. I’ve read some positive reviews of Bricks and Oxygen on Reddit threads, but have not yet tested them. The native WordPress block editor, formerly known as “Gutenberg,” is very lean, but not very user-friendly. Hardcore developers will say that you don’t need a page builder at all and that a framework like Genesis is best, but if you manage your own website, you may want to avoid that.
The bottom line is that the decision between a native block editor, a page builder, or a framework depends on each site’s needs. Do your research about what the current best options are for your particular use case if you’re about to undergo a WordPress redesign.
Personally, I use Elementor and layer Nitropack on top. It does a good enough job, but when the time for my next redesign comes, I’ll be doing further research to see what the fastest and most user-friendly options are available at that time.
Hosting
Server response time, a.k.a “time to first byte” or “TTFB,” is the amount of time it takes for a web server to respond to a request from a browser. It is typically mostly dependent upon hosting resources (the hardware resources of the server hosting the site and configuration of that server), but it can be affected by on-site resources as well (scripts, database, number of http requests, etc.).
Google considers under 800 millseconds to be acceptable for TTFB, and most ideal is 200 milliseconds or less.3
If you have a WordPress site, ensure that you’re on a hosting plan that is specifically tuned for WordPress.
Images
Images are usually the single biggest performance culprit on a website. Per HTTP Archive’s 2024 Web Almanac, 73% of mobile pages have an image as their Largest Contentful Paint (LCP) element, which means optimizing images is often the fastest way to move your Core Web Vitals scores.4
File Size
Aim for under 150kb per image. When saving, choose 72 dpi and, if possible, the .webp file format. Google recommends .webp over .jpg or .png because it produces smaller files at the same visual quality. The even newer .avif format can go smaller still and is supported by most modern browsers, so it’s worth using if your tools support it.
Images can be further optimized (and converted to .webp or .avif) by plugins like Imagify and web tools like Squoosh.app. If you need a set-it-and-forget-it option for WordPress, plugins like Imagify, ShortPixel, or EWWW Image Optimizer can auto-compress images on upload and bulk-compress what’s already in your library.
Image Dimensions
Export images from your photo editor at the exact size they will display on the desktop version of the site instead of uploading oversized images that the browser has to “squish” into a smaller spot. For example, if the image spot in your template is 300px by 300px, export at 300px by 300px.
Responsive (Mobile) Images
Use the srcset attribute to serve different image sizes based on screen resolution and device. WordPress handles this automatically for images added through the media library, so the main thing you need to do is upload a large enough original and let WordPress generate the smaller variants.
Lazy Loading Below the Fold
Images that appear below the fold should use loading=”lazy” so the browser doesn’t download them until the user scrolls toward them. WordPress applies this automatically to most images, but double-check that your theme or page builder isn’t overriding it.
Prioritize Your LCP Image
For the single most important image on each page (usually your hero image or the largest visible element above the fold), add fetchpriority=”high”. Google’s own analysis found that only about 15% of eligible pages use this attribute, even though it’s one of the easiest LCP improvements available. Just as important, make sure your LCP image is a normal <img> tag with a real src, not hidden behind data-src or loaded by JavaScript. Google found that 35% of LCP images across the web aren’t discoverable in the initial HTML, which delays how quickly the browser can start downloading them.5
Plugins
Plugins, while useful and convenient, can slow site speed by loading unnecessary files and scripts on every page of your site. Plugins that are activated but not in use should be deactivated and removed. Poorly coded, slow-loading, or no-longer-supported plugins should be replaced with newer, better alternatives.
Caching
Caching pre-processes the code needed to create website content and stores the already-processed version in memory to be served up to a user faster than if the server had to execute the code manually every time a request comes in. A lack of caching can slow page load time significantly.
Code Compression and Minification
Compression and minification decrease file sizes by removing unnecessary spaces, line breaks, and comments from JS and CSS files. Removing unnecessary data and compressing the result reduces the overall file size, thus allowing the data to load faster in the browser.
Database Size
A site that has been around for a while will naturally have “cobwebs” such as old post revisions, transients that don’t expire, orphaned post meta, spam comments, and other characteristics that prevent the database from functioning quickly. Tools like WP-Optimize can help with this.
Third-Party HTTP Requests
Every time a user visits your website, and then your website calls out to another website (for example, to send data from a tracking pixel), HTTP requests are made to those third-party servers. Reducing the number of HTTP requests made to your server allows the page to load faster. Regularly audit your tracking pixels and remove the ones you no longer need. Per the 2024 Web Almanac, presentation delay from third-party scripts (behavior tracking, consent providers, chat widgets, CDNs for tags) is the main driver of poor INP scores.6
Render-Blocking CSS and JavaScript
Websites often include CSS or JavaScript files that are required to load before the rest of the page loads. Scripts that are not necessary to load above-the-fold content should be deferred or asynchronously loaded.
CDN
A content delivery network (CDN) improves site speed by serving content to users from stored files on a server that is closest to them geographically. They also handle edge caching of HTML, image transformation, Brotli compression, and, in some cases, edge compute. But check your hosting plan before looking into CDN options as many modern plans, especially WordPress-specific ones, include a CDN as part of the hosting package.
How to Test Website Speed
The Human Test
First, conduct your own test using the true human test. Try loading various pages on your site in your browser, then try loading them on your smartphone. Try doing the same with competitor websites and see how their pages load in comparison.
Were you pleased with the experience of navigating through various pages of your site? Or were you gritting your teeth wondering why the damn thing hadn’t loaded yet? Hopefully, you found yourself somewhere in the middle. If your website speed fails the human test, it will most assuredly fail the more technical testing tool I’m about to go over.
Tools to check website speed
PageSpeed Insights
Google’s free page speed tool provides a breakdown of the different metrics Google looks at to determine an overall speed score by weighted average. These include Core Web Vitals (CWV) such as Largest Contentful Paint (LCP), Total Blocking Time (TBT), Cumulative Layout Shift (CLS), Speed Index, and First Contentful Paint (FCP).
The goal is a score of 90 or above, which will display a green circle. That’s very difficult on mobile, though, so don’t beat yourself up if you can’t quite hit that – just get as close as you can.
The PageSpeed Insights score is helpful, but don’t sleep on field data! For years, I relied solely on synthetic testing tools like PSI and GTMetrix to gauge performance. I thought I had a good handle on speed. Then, Google introduced Core Web Vitals and emphasized Field Data from the Chrome User Experience (CrUX) report. It was a wake-up call. Seeing how my ‘lab’ scores didn’t always reflect the actual user experience highlighted a significant gap in my understanding. I had to completely re-evaluate how I measured and prioritized speed optimization.
What is Field Data vs. Lab Data?
Google’s PageSpeed Insights shows you two different types of Data: Field and Lab.
Field Data
Field Data is what your users are actually experiencing on their browsers. This is collected through the CrUX (Chrome User Experience) dataset of users who have opted in to data sharing. This can be considered the most accurate because it is coming from actual users across all network conditions, devices, and geographies.

Lab Data
Lab Data is the PageSpeed Insights score that the report gives you after simulating a visit to your page with a specific device and network speed. It can be useful for debugging and identifying issues in the development process.
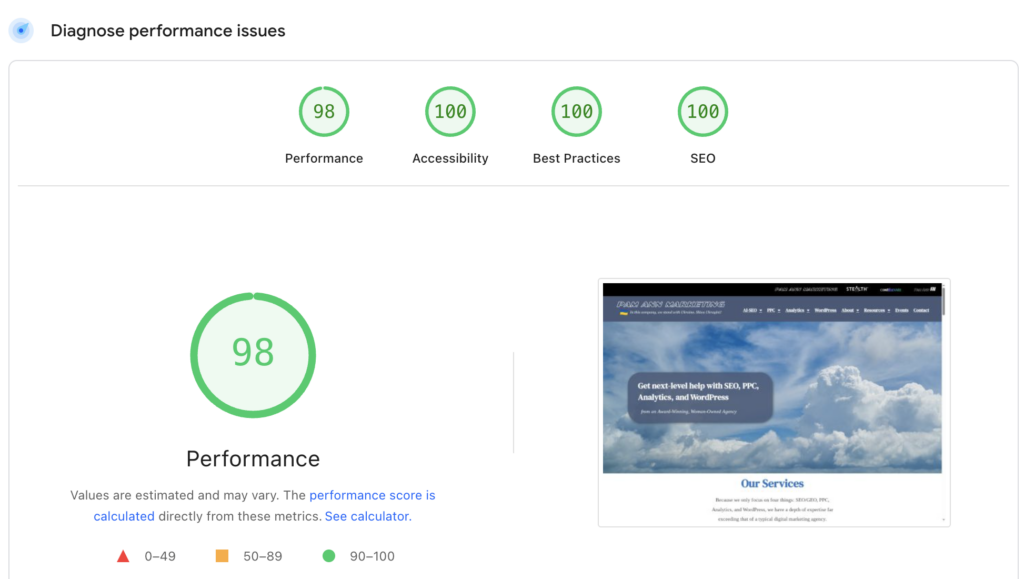
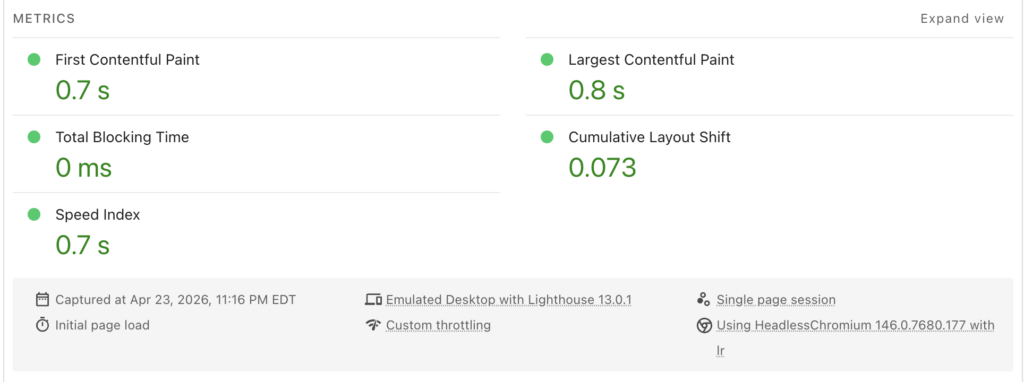
PageSpeed Insights will also give you tips on what may be slowing your site down.

Lighthouse
Lighthouse is accessible through Chrome Dev Tools and is the auditing tool that powers the Lab Data section of PageSpeed Insights. This report shows Performance, Accessibility, Best Practices, and SEO scores.
Search Console
While not necessarily a testing tool, Core Web Vitals performance data can be found in the Search Console dashboard and sometimes at the top of PageSpeed Insights if there is enough data. Search Console will list URLs that have any issues. The three main Core Web Vitals are LCP, CLS, and Interaction to Next Paint (INP). As you can see, there is some overlap between PageSpeed Insights and Core Web Vitals.
Other Tools
There are 3rd party tools that can give more insights such as:
- WebPageTest: Allows testing from multiple geographic locations (e.g., test load time from India vs. the US). Can simulate specific browsers and devices. It generates a video of the page load, showing exactly what the user sees frame by frame.
- GTMetrix: Provides a comprehensive breakdown of load order, content size, and requests. It gives clear, actionable grades based on its own analysis (Structure and Performance scores). Can track the performance history of a URL over time.
Conclusion
Page speed is important, and every year it becomes even more so. Testing your page speed regularly is the first step to ensuring you continue to please both website visitors and Google algorithms. Need help with your site’s speed? Check out our Technical SEO Audit service!
- https://almanac.httparchive.org/en/2025/performance ↩︎
- https://addyosmani.com/blog/core-web-vitals/ ↩︎
- https://developers.google.com/speed/docs/insights/v5/about ↩︎
- https://almanac.httparchive.org/en/2024/performance ↩︎
- https://web.dev/articles/top-cwv ↩︎
- https://almanac.httparchive.org/en/2024/performance ↩︎

- How to Optimize Your Article Content for SEO and GEO/AEO - August 28, 2026
- Why All AI-SEO Studies are Flawed (and What to Trust Instead) - March 12, 2026
- How Much AI-Generated Content is Acceptable for SEO Writing? - February 25, 2026