

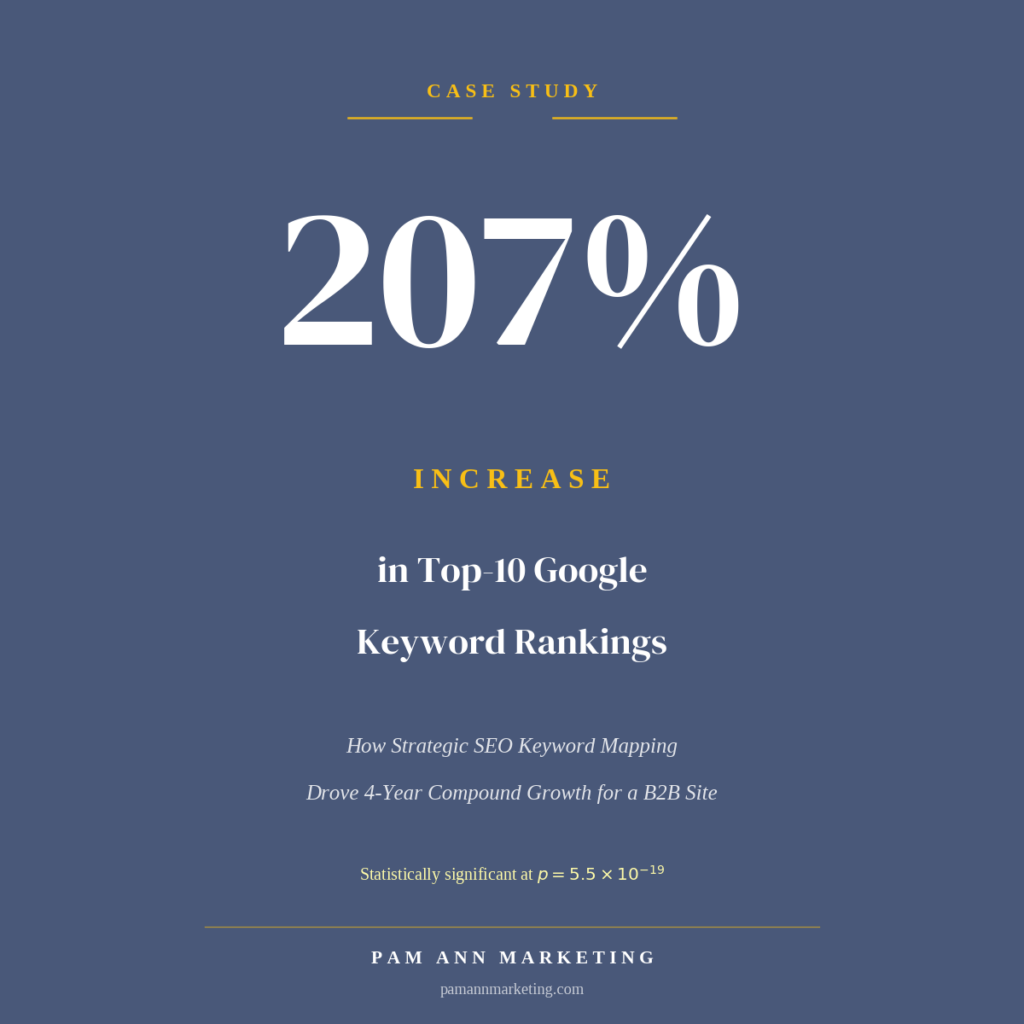
This is a case study about a B2B specialty insurance provider we have been working with over the past three years, which saw its number of top-10 Google search results positions increase 207% after consistently implementing our strategic keyword mapping as a core component of a coordinated SEO program.
The Results
A B2B specialty insurance provider engaged Pam Ann Marketing in March 2022 for a coordinated SEO program anchored by strategic keyword mapping.
Findings from 62 months of SE Ranking domain history (Feb 2021 to Mar 2026) and 13 months of GA4 conversion data (Mar 2025 to Mar 2026) are as follows:
- Top-10 Google rankings grew 207% from 321 in June 2022 to 984 in March 2026, statistically significant at p = 5.5 × 10⁻¹⁹. Compared with the 13-month pre-engagement baseline mean of 237, growth is 315%.
- Top-5 Google rankings grew nearly 6x from a 13-month pre-engagement mean of 113 to 666 in March 2026, a 490% increase, p ≈ 10⁻⁹.
- Position quality more than doubled. The share of all ranked keywords sitting in positions 1 to 5 grew from a 4.49% pre-engagement mean to 9.27% across the recent 13-month window, p ≈ 10⁻⁵.
- AI Overview visibility climbed despite substantial inventory expansion. While total AI Overview inventory across this site’s tracked SERPs grew from 179 AIO-bearing SERPs in September 2024 to 2,925 in March 2026 (a 1,534% expansion), the site’s share of AIO citations trended upward from a Sept 2024 to Aug 2025 mean of 8.24% to a Sept 2025 to Mar 2026 mean of 10.86%, a statistically significant relative gain (p = 0.012).
- Conversion rate climbed 21% as click volume softened. From a March 2025 to August 2025 mean of 3.35% to a September 2025 to March 2026 mean of 4.06%, with the trend across all 13 GA4 months statistically significant at p = 0.005. Throughout the period, no changes were made to GA4 key event tracking definitions or configuration.
- LLM-referred traffic emerged as a small but high-converting new channel. 627 sessions over 13 months at a 13.6% conversion rate, compared with about 3.7% from organic search.
These findings are correlations observed during a coordinated multi-pillar program. The data is consistent with a meaningful effect of the program, but does not isolate keyword mapping as a sole cause.
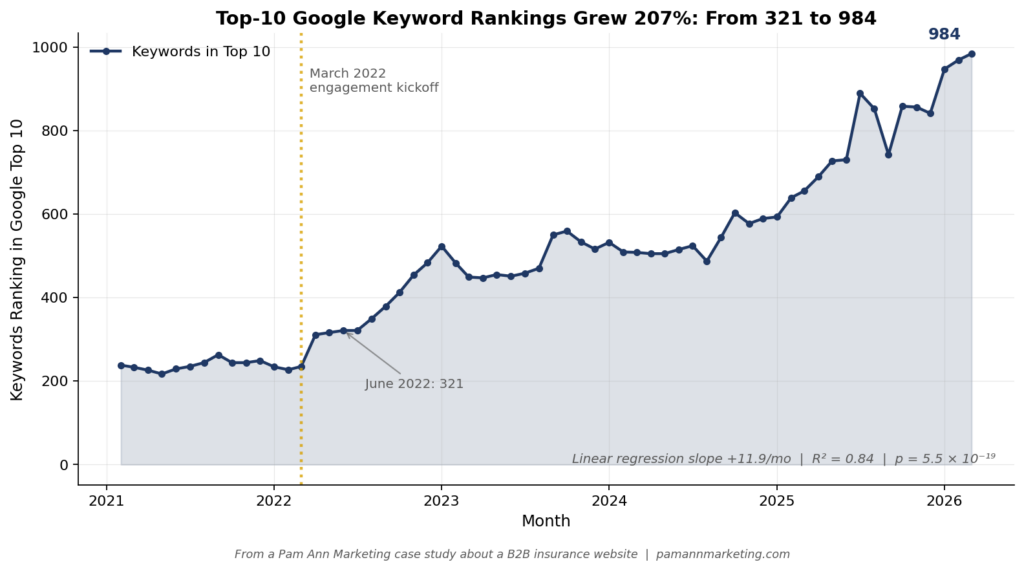
Figure 1. Top-10 Google keyword rankings over time. Pre-engagement baseline (Feb 2021 to Feb 2022, n = 13 months) had a mean of 237 top-10 keywords (range 217 to 263). From June 2022 (321 keywords) to March 2026 (984), the count grew 207%, statistically significant at p = 5.5 × 10⁻¹⁹.
What is Keyword Mapping?
Keyword mapping is an SEO practice in which keywords are strategically organized into groups and assigned (“mapped”) to specific pages on a website. It involves researching keywords, grouping them by topic and intent, assigning primary and secondary phrases to each page, and preparing meta tag content for each page. It also creates a basis for tracking the desired keyword ranking performance for each page over time.
For this client, the process produced a master keyword mapping spreadsheet with ten columns per page: Page Name, Page URL, Existing Keyword Rankings, Keyword Ideas, Primary Keywords, Secondary Keywords, Title Tag draft, H1 Tag draft, Meta Description draft, and Notes. Pages were keyword-mapped separately from blog posts, with high-intent keywords reserved for static pages and informational queries reserved for editorial articles, to avoid keyword cannibalization and confusion in Google’s understanding of which URL covered which topic.
Client Background
The client is a specialty commercial insurance provider operating in a B2B professional services vertical. To preserve client confidentiality, specific industry and brand details have been anonymized. Relevant characteristics:
- Established brand with consistent editorial content and subject matter authority
- Limited prior investment in structured search engine optimization
- Existing blog program in place but not yet aligned to a keyword strategy
- Technical issues including sub-benchmark mobile page speed
- Analytics infrastructure in place but not fully utilized for SEO decision making
The Challenge
At the time of engagement, the client had strong editorial output but no systematic strategy for connecting that content to search demand. Multiple pages competed for similar terms without a deliberate keyword hierarchy. Priority commercial keywords were either unassigned to any optimized page or were weakly represented in page metadata. Technical crawlability issues compounded the problem.
The central question: could a disciplined keyword mapping exercise, combined with coordinated technical and content optimization, move the needle on organic visibility?
Methodology
The engagement applied a three-pillar framework with keyword mapping as the strategic anchor.
Pillar 1: Strategic Keyword Mapping
A comprehensive keyword research and mapping exercise produced a master keyword mapping spreadsheet assigning priority target keywords to specific URLs. The mapping resolved internal keyword competition, surfaced gaps where high-value terms had no dedicated landing page, and became the reference document for all subsequent content and on-page optimization work.
The mapping process followed our standard methodology: keyword research using a database of relevant phrases (including existing rankings preserved from Google Search Console), pairing keywords with URLs, grouping by theme to match user intent, and only then beginning content optimization. Each page received primary and secondary keyword assignments with drafted Title Tag, H1, and Meta Description suggestions.
Our SEO Keyword Mapping Template is available for free download.
Pillar 2: Technical Optimization
A proprietary 50-point technical audit was performed during kickoff and recommendations were delivered to the client. Implementation timing for specific technical recommendations is not documented in the data sources used for this study.
Pillar 3: Content Optimization and Blog Integration
The client already had a blog program underway. Beginning in June 2022, we layered in keyword-first practice. Each month, we delivered keyword mapping for three new articles or rewrites, specifying primary keywords, secondary keywords, and internal link suggestions. The client’s content team wrote the articles using our SEO copywriting optimization guidelines.
Implementation Timeline
| Phase | Activity |
| March to April 2022 | Engagement kickoff. Keyword mapping completed for approximately 10 static pages. 50-point technical audit performed and recommendations delivered. |
| June 2022 onward | Monthly delivery of keyword mapping for three new articles or rewrites began. Each delivery specified primary keywords, secondary keywords, and internal link suggestions. |
| October to November 2022 | Client implemented page-level on-page optimizations across the static pages, applying the assigned primary and secondary keywords from the master keyword mapping spreadsheet. |
| November 2022 onward | Articles incorporating the keyword research we began providing in June 2022 began publishing on the site. The client’s content team writes several months in advance of publication, which produced this lag. The monthly cadence of three keyword-mapped articles has held consistent since. |
| Mid-2025 | Formalized a specification for formatting each article for LLM-friendliness. Began incorporating AI Overview opportunity analysis into the keyword mapping process. Using SE Ranking’s SERP feature data, keywords where Google’s AI Overview was already appearing for the query but the client’s site was not yet cited are flagged as AIO opportunities and prioritized for content optimizations formatted for AI Overview eligibility. |
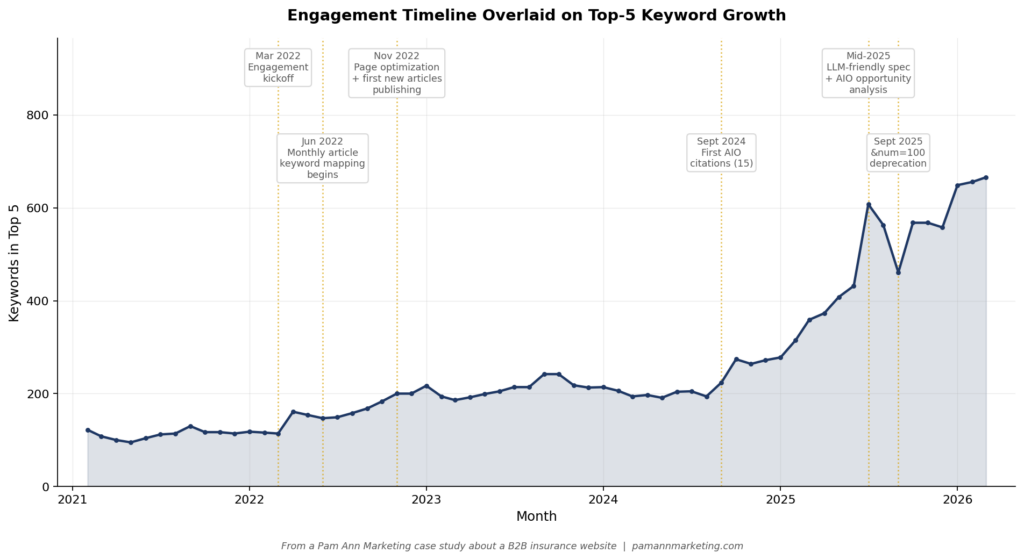
Figure 2. Engagement timeline overlaid on Top-5 keyword growth. Vertical markers show key program milestones.
A Note on September 2025 Measurement Changes (AI Overview Impact Analysis)
In early September 2025, Google deprecated the &num=100 URL parameter that had allowed SEO measurement tools to view 100 search results in a single page load. Combined with the broader effect of AI Overviews on SEO across the industry, the change altered several reported metrics overnight:
- SE Ranking’s automatic discovery database became shallower, causing total ranked keyword counts to drop sharply (this client’s data showed a 17% drop from August to September 2025, with rankings themselves unchanged).
- Google Search Console impression counts dropped because bot-driven impressions from SEO tools disappeared.
- GSC average position numerically improved because deep-page results stopped being scanned and factored into the average.
The AI Overview impact on CTR is also industry-wide, as AI Overviews answer queries directly within the search results page and reduce the number of users who continue to a website. Real rankings and real human click volume were unaffected by the &num=100 change itself, but click volume across the broader industry has softened due to AI Overviews. The findings below either use metrics unaffected by these measurement changes or explicitly handle the discontinuity.
Findings
These findings describe correlations observed during the engagement period. They do not isolate any single program component as the sole cause of any single outcome.
Finding 1: Top-10 Keyword Rankings Grew 207%
The count of keywords ranking in Google’s top 10 results grew from 321 in June 2022 to 984 in March 2026, a 206.5% total increase. A linear regression on the 46-month June 2022 to March 2026 series produces a slope of +11.9 keywords per month with R² = 0.838 and p = 5.5 × 10⁻¹⁹.
Comparing the 13 months of pre-engagement data (Feb 2021 to Feb 2022, mean = 237.2 top-10 keywords) to the 13 most recent months (Mar 2025 to Mar 2026, mean = 826.1) yields a Welch’s t-statistic of -19.48 and p = 1.3 × 10⁻¹⁰. Using the pre-engagement mean as the baseline, total growth to March 2026 is 315%.
This metric is robust to the September 2025 &num=100 deprecation because positions 1 through 10 are tracked reliably regardless of the deprecation. The growth trajectory continued through the measurement-change period and reached its all-time high in March 2026.
Finding 2: Top-5 Keyword Rankings Grew Nearly 6x
The count of keywords ranking in Google’s top 5 results grew from a 13-month pre-engagement mean of 112.8 (σ = 9.3, range 95 to 130) to 666 in March 2026, a 490% total increase. A Welch’s two-sample t-test comparing the 13 pre-engagement months to the 13 most recent months (mean = 528.4) yields t = -13.70 and p = 9.2 × 10⁻⁹.
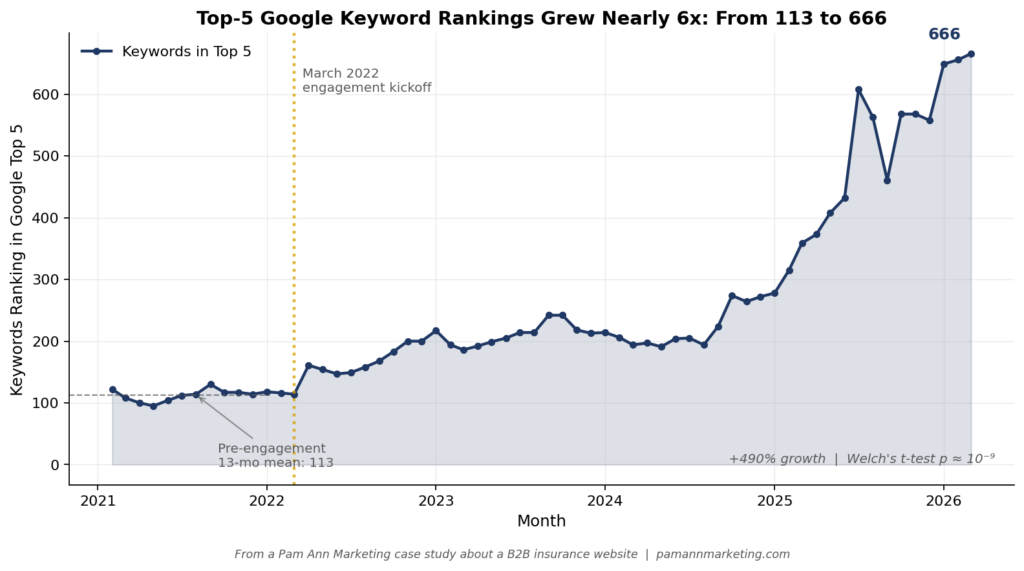
Figure 3. Top-5 Google keyword rankings over time, with pre-engagement baseline shaded.
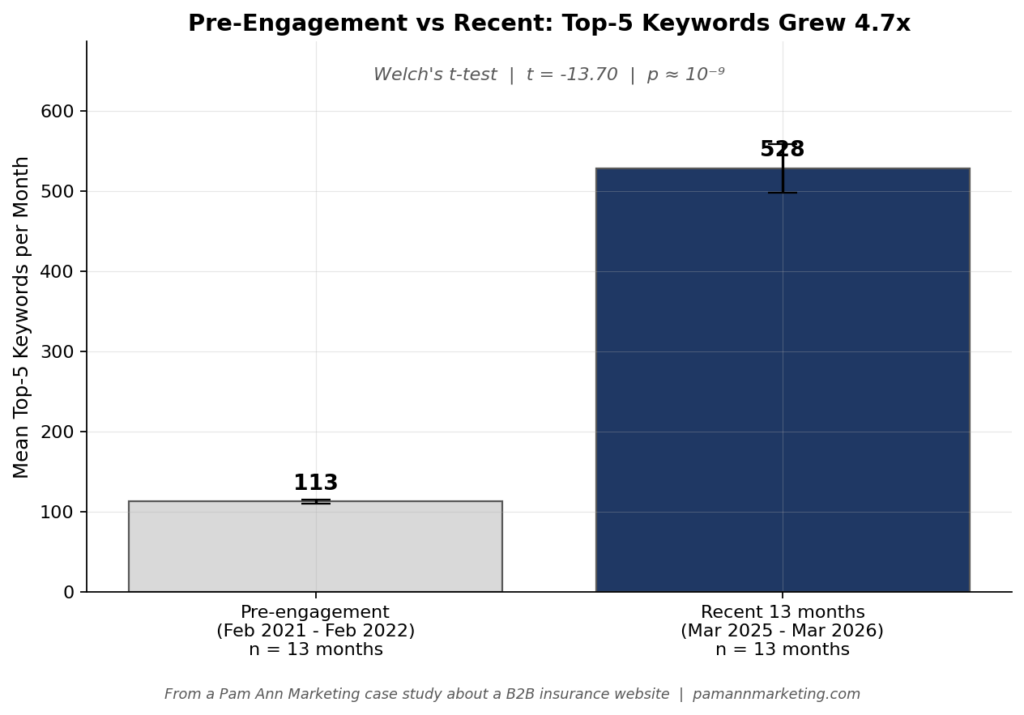
Figure 4. Pre-engagement (Feb 2021 to Feb 2022) vs recent 13 months (Mar 2025 to Mar 2026): Top-5 keyword count grew 4.7x by mean comparison, statistically significant at p ≈ 10⁻⁹.
Finding 3: Position Quality Improved Substantially
Beyond raw count growth, the qualitative composition of the keyword footprint shifted toward higher-value positions. The share of all ranked keywords sitting in positions 1 to 5 grew from a 4.49% pre-engagement mean (Feb 2021 to Feb 2022) to a 9.27% mean across the recent 13 months (Mar 2025 to Mar 2026). Welch’s t-test on the share metric gives t = -6.76 and p = 1.8 × 10⁻⁵.
This finding is also robust to the September 2025 measurement change because both numerator (top 5) and denominator (total) were affected proportionally to the extent any was.
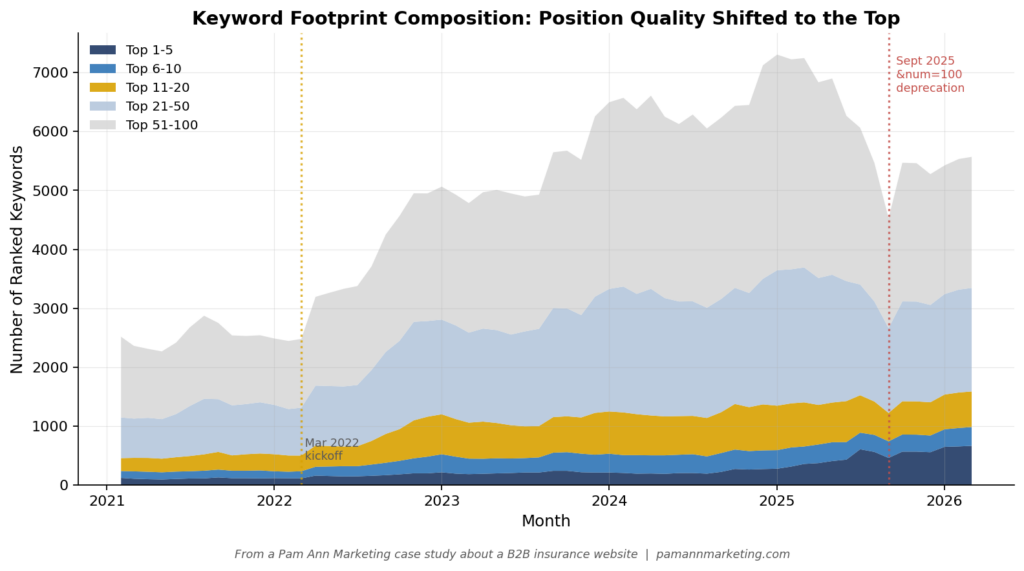
Figure 5. Stacked composition of the keyword footprint by position bracket. Top 1-5 (dark navy) expanded substantially over the engagement; the September 2025 vertical drop in deeper positions is the &num=100 deprecation artifact.
Finding 4: AI Overview Visibility Grew Despite Substantial Inventory Expansion
AI Overview visibility analysis requires controlling for the substantial expansion of AI Overview inventory across SERPs during the measurement window. Total AI Overview inventory across this site’s tracked SERPs grew from 179 AIO-bearing SERPs in September 2024 to 2,925 in March 2026, a 1,534% expansion driven by Google’s rollout of AI Overviews across more queries. For this reason, the absolute count of AIO citations would be a misleading measure of program impact. The proper metric is AIO Visibility, defined as the share of AIO-bearing SERPs where the site is cited within the AIO block, which controls for inventory expansion.
AI Overview visibility data is available beginning September 2024 (the first month any AIO citations were tracked for this site). Across that 19-month window:
- Mean AIO visibility was 9.21% (range 4.5% to 13.4%).
- Linear regression on AIO visibility over time gives slope +0.294 percentage points per month, R² = 0.39, p = 0.004.
- Comparing pre Sept 2025 (mean 8.24%) to post Sept 2025 (mean 10.86%), Welch’s t = -2.89, p = 0.012, a 32% relative improvement in AIO visibility.
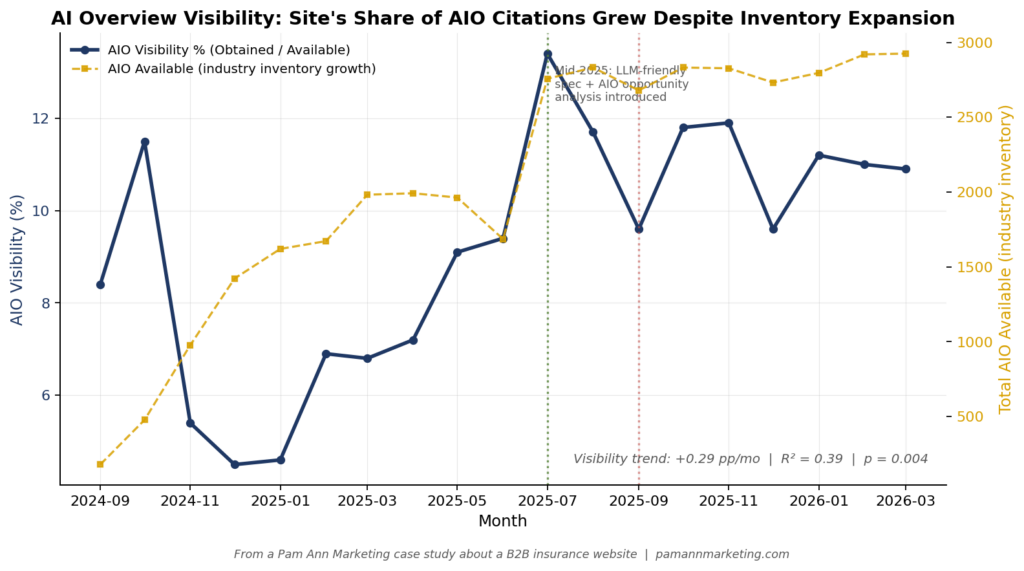
Figure 6. AIO Visibility % (left axis, navy) climbed steadily over time despite a 1,534% expansion in total AIO inventory across this site’s tracked SERPs (right axis, gold). The visibility metric is the meaningful KPI here.
For reference, the absolute count of AIO citations grew from 15 (September 2024) to 320 (March 2026). The acceleration in late 2025 corresponds in time to our mid-2025 introduction of the LLM-friendly content specification and the AI Overview opportunity analysis layered into the keyword mapping process. We note this as a temporal correlation; the causal contribution of any specific tactic cannot be isolated from observational data alone.
Finding 5: How AI Overviews Affect Click-Through Rate and Conversion Rate
A common concern about Google AI Overviews is that they reduce click-through rate to organic search results by answering queries directly within the SERP. This client’s GA4 data, covering March 2025 through March 2026 (the 13-month window during which AI Overviews accelerated their impact across the industry), provides a clear view of what the AIO disruption did and did not do to actual business outcomes.
Before reviewing the data, an important methodology note: we confirmed via GA4’s property change history (which retains 24 months of records) that no changes were made to GA4 key event tracking definitions, conversion event triggers, or related configuration during the entire reporting period covered by this finding. The conversion trends below cannot be attributed to tracking changes.
Click volume dropped meaningfully across the September 2025 boundary.
- March 2025 to August 2025 mean sessions: 2,803 per month (n = 6)
- September 2025 to March 2026 mean sessions: 2,227 per month (n = 7)
- Welch’s t-test t = 4.74, p = 0.0006 (a roughly 21% click-volume decline)
Conversion rate climbed 21% over the same window.
- March 2025 to August 2025 mean conversion rate: 3.35%
- September 2025 to March 2026 mean conversion rate: 4.06%
- Linear regression on session key event rate across all 13 months: slope +0.00135 per month, R² = 0.532, p = 0.005
As a result, key event volume did not decline.
- March 2025 to August 2025 mean key events: 145.3 per month (n = 6)
- September 2025 to March 2026 mean key events: 136.3 per month (n = 7)
- Welch’s t-test t = 0.72, p = 0.49 (no statistically significant difference at α = 0.05)

Figure 7. The AI Overview impact on this site, in three lines: sessions declined sharply after September 2025 (blue, left axis), conversion rate climbed (gold, right axis), and key events held statistically flat (green, left axis).
The combined picture is the central business finding of this case study. The roughly 21% drop in click volume occurred alongside a roughly 21% climb in conversion rate, leaving total conversions essentially unchanged. This pattern is consistent with AI Overviews pre-qualifying users before they click, sending fewer but better-informed visitors to the site. Whether the program’s deliberate optimizing for AI Overviews contributed to this dynamic, versus being a function of broader market behavior, cannot be determined from the data alone.
Finding 6: LLM-Referred Traffic Emerged as a New Channel
Across March 2025 through March 2026, the site received traffic from five identified LLM referrers in this study (ChatGPT, Perplexity, Gemini, Microsoft Copilot, and Claude):
| LLM | Sessions | Key Events | Conversion Rate |
| ChatGPT | 487 | 78 | 16.0% |
| Perplexity | 81 | 0 | 0% |
| Gemini | 29 | 0 | 0% |
| Microsoft Copilot | 22 | 7 | 31.8% |
| Claude | 8 | 0 | 0% |
| Total | 627 | 85 | 13.6% |
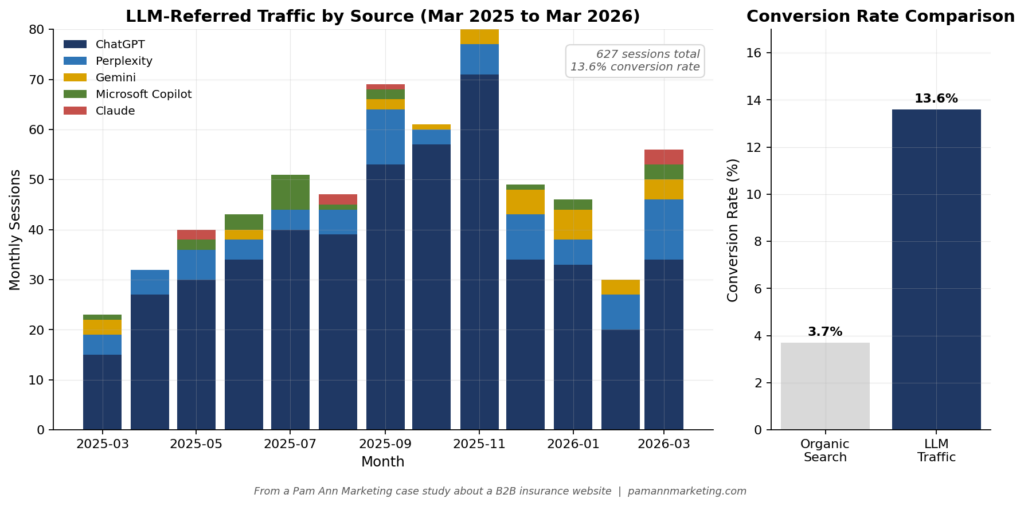
Figure 8. Monthly LLM-referred sessions stacked by source (left); LLM conversion rate vs organic search (right). ChatGPT dominates LLM traffic, and combined LLM traffic converts at roughly 3.7 times the rate of organic search.
In absolute numbers this remains small (about 48 sessions per month on average), but the conversion rate is materially higher than organic search (13.6% vs 3.7%). A linear regression on monthly LLM session totals gives a positive slope of +1.66 sessions per month with R² = 0.167 and p = 0.17, so the trend is not statistically significant within this short window. Comparing the first three months to the last three months of the window, total LLM sessions rose from a mean of 31.7 to 44.0 per month, a 39% relative gain. The directional signal is consistent with growing LLM channel relevance, but more data is needed to establish a statistically significant trend.
Finding 7: Total Keyword Count (Reported With Caveats)
Total keywords ranking grew from a 13-month pre-engagement mean of 2,517 to a peak of 7,332 in January 2025, a 191% increase. After the September 2025 &num=100 deprecation, the count contracted 17% in a single month (from 5,484 to 4,545), then partially recovered to 5,592 by March 2026.
We do not feature total keyword count as a primary KPI because the post-September 2025 measurement is not directly comparable to earlier data. The figure is included for context only.
Limitations
Single-engagement evidence. Findings come from one client. Statistical significance within the time series is solid, but generalizability requires replication across additional engagements.
No control condition. Keyword mapping was implemented alongside technical optimization recommendations and an ongoing content program. The combined-program effect cannot be cleanly decomposed from observational data alone.
Measurement-change sensitivity. The September 2025 &num=100 deprecation altered the meaning of several metrics overnight. The findings above were structured to either avoid affected metrics or explicitly handle the discontinuity.
LLM referrer attribution. GA4 attributes LLM-referred traffic only when the referring LLM passes a usable referrer string. Some LLMs frequently appear without one. The 627 LLM session count is therefore a lower bound on actual LLM-influenced traffic.
Technical implementation timing. The October to November 2022 work documented in this study was the client’s page-level on-page optimization, applying the keyword assignments from the master spreadsheet. Implementation timing for specific technical-audit recommendations is not documented in the data sources used for this analysis.
Single missing data point. May 2022 SE Ranking domain history was not exportable from the dashboard. The May 2022 figures used in this analysis were taken from a SE Ranking dashboard tooltip screenshot rather than a CSV export. All other 61 monthly data points came from CSV exports.
Conclusion
Statistical testing of 62 months of SE Ranking domain history and 13 months of GA4 conversion data for this engagement supports six descriptive conclusions: top-10 keyword count grew 207% (June 2022 to March 2026) with overwhelming statistical significance; top-5 count grew nearly 6x (113 to 666); the share of keywords in positions 1 to 5 more than doubled (4.49% to 9.27%); AI Overview visibility grew steadily through the AIO inventory expansion period; conversion rate growth offset a 21% click-volume decline so completely that key event volume showed no statistically significant change; and LLM-referred traffic emerged as a small but high-converting new channel.
These findings are correlations observed during a coordinated multi-pillar program. They are not causal claims about any single component, including keyword mapping, in isolation. The data is consistent with a meaningful effect of the coordinated program.
For B2B organizations with quality content and limited prior SEO investment, a coordinated keyword-mapping-led program merits serious consideration. Keyword mapping alone is unlikely to produce these results. The combination of strategic mapping, a technical audit, an ongoing content program, and (from mid-2025 forward) deliberate AI Overviews optimization is what produced the observed outcomes for this client.
About This Case Study
Prepared using SE Ranking domain history exports (US database, monthly) for the client domain from February 2021 through March 2026 (62 months), joined with GA4 Organic Search and LLM-referrer session and key event data from March 2025 through March 2026. All figures are anonymized relative to the specific client identity but are otherwise unmodified from source reporting. Statistical tests performed in Python using SciPy, with Welch’s correction applied to all two-sample t-tests due to unequal sample sizes and unverified variance equality. Methodology notes and source data available on request.
This case study was prepared with AI assistance (Anthropic’s Claude Opus 4.7) for data processing, statistical analysis, chart generation, and initial drafting. All numerical findings, claims, and conclusions were reviewed, verified against source data (SE Ranking domain history exports and GA4 property data), and approved by Pam Aungst Cronin before publication.
Cite This Case Study
Cronin, P. A. (2026). Ongoing SEO Keyword Mapping Leads to 207% Increase in Top-10 Keywords. Pam Ann Marketing. https://pamannmarketing.com/ongoing-seo-keyword-mapping-leads-to-207-increase-in-top-10-keywords
- Why All AI-SEO Studies are Flawed (and What to Trust Instead) - March 12, 2026
- How Much AI-Generated Content is Acceptable for SEO Writing? - February 25, 2026
- How to Spot a “Black Hat” SEO/GEO Scam in 2026 - January 8, 2026