We’re wrapping up our blog series detailing each element of the page experience criteria Google will be adding to their search algorithms in 2021. We’ve already covered the first two Core Web Vitals: the page loading metric, Largest Contentful Paint (LCP), and the interactivity metric, First Input Delay (FID).
Now, we’re diving into the final metric, which covers visual stability, or Cumulative Layout Shift (CLS). Read on to learn about cumulative layout shift and how to optimize your site’s CLS metric score before it’s included in Google’s algorithms next year.
What is Cumulative Layout Shift?
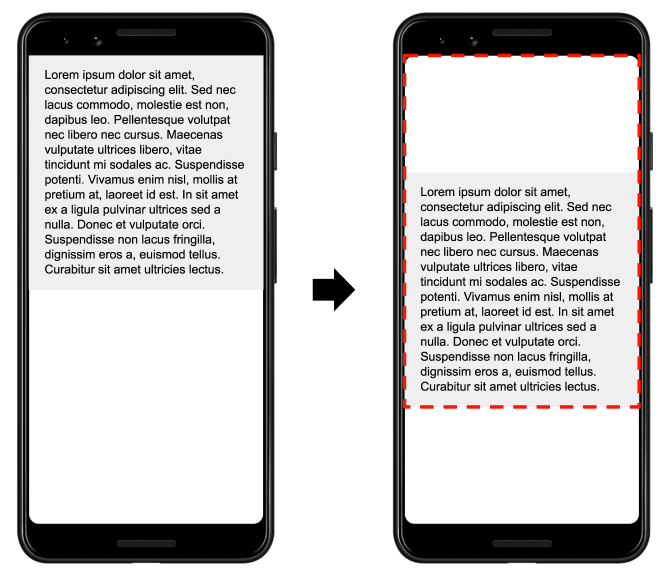
Cumulative Layout Shift (CLS) measures the visual stability of a webpage and the number of unexpected layout changes the user experiences. The ultimate goal of this metric score is to improve visual stability in web design.

Most of us have had the unfortunate experience of interacting with a web page with constantly shifting elements. For example, you could be reading an article on a site when, all of a sudden, the content jumps, making you lose your place. While that’s a minor annoyance, there are sites where the poor visual stability of their web design can cause you to click or tap on something you didn’t intend to.
According to Web.Dev, it can be difficult to identify visual stability issues in your web design because the way “a site functions in development is often quite different from how users experience it. The Cumulative Layout Shift (CLS) metric [can help you identify these problems] by measuring how often [they are] occurring for real users.”
What is an Ideal Cumulative Layout Shift Score?
The CSL metric measures the total number of all individual layout shift scores, which account for every unexpected layout shift that occurs during the lifespan of your webpage. A layout shift occurs any time a visible element changes its position from one rendered frame to the next.
To provide the best experience for users, you should aim for your site to have a CLS score of 0.1 or less. As with the largest contentful paint metric, Google recommends using the 75th percentile of page loads, on both mobile and desktop, to get an accurate performance threshold.
How to Calculate Your Webpage’s Cumulative Layout Shift Score
Your webpage’s cumulative layout shift score is calculated using two metrics: impact fraction and distance fraction. Search Engine Journal defines each metric as follows:
- Impact Fraction — This is a measurement of how much space an unstable element of your website takes up in the user’s viewport from one rendered frame to the next. The viewport is the area of your site users can see on their devices.
- After an element on your webpage shifts, Google calculates the impact fraction by measuring the percentage of the viewport the element originally occupied as well as the percentage of additional space the element occupies after it shifts.
- In the example Google provides, an element on your webpage originally occupies 50% of the viewport and then drops down by another 25%.

- So, the shifting element on your webpage ultimately occupied 75% of the viewport (50% + 25% = 75%), which is expressed as 0.75 for the impact fraction.
- Distance Fraction — This is the amount of space the page element has shifted from its original position to its final position. Continuing with the same example, the element on your webpage shifted to occupy an additional 25% o the viewport. So, the distance fraction score is 0.25.
The formula used to calculate your webpage’s cumulative layout shift is:
Impact Fraction x Distance Fraction = CLS score
Using the impact fraction and distance fraction scores from the example above, the formula to calculate your webpage’s CLS score is:
0.75 x 0.25 = 0.1875
Rounded up, a CLS score of 0.19 falls within the Needs Improvement range on the cumulative layout shift scale.
How to Improve the Cumulative Layout Shift of Your Web Design
According to Google, there are five reasons why layout shifts happen. They are caused by:
- Images without dimensions
- Ads, embeds, and iframes without dimensions
- Dynamically injected content
- Web fonts causing FOIT (Flash of Invisible Text) and FOUT (Flash of Unstyled Text)
- Actions waiting for a network response before updating DOM (the document object model)
Web.Dev provides comprehensive instructions for diagnosing and fixing each of these possible causes for your webpage’s poor CLS score, including ways to avoid large layout shifts.
You can also perform your own cumulative layout shift test on your website by using the Chrome User Experience Report, Chrome DevTools, Lighthouse, PageSpeed Insights, Search Console (Core Web Vitals report), and the Web Vitals Chrome extension.
Need Help?
Want to see how your website measures up against Google’s new page experience criteria? We can conduct an SEO technical audit to help you improve your website’s cumulative layout shift score before Google includes the metric in their algorithm. Contact us for a proposal!
*Image credits: Google and Web.Dev
- Google is Helping U.S. Government Sites Advertise the Sale of Illegal Drugs - October 16, 2024
- Google Has Been Ruled a Monopoly in Antitrust Lawsuit (Video) - August 9, 2024
- New Domain or Subdomain? Which is Better for SEO? - October 13, 2023
